The code is open-source and available on Github.
Introduction
Anomaly detection is a method used to detect outliers in a dataset and take some action. Example use cases can be detection of fraud in financial transactions, monitoring machines in a large server network, or finding faulty products in manufacturing. This blog post explains the fundamentals of this Machine Learning algorithm and applies the logic on the Spark framework, in order to allow for large scale data processing.

Indeed, this was a real SMS I received from my bank after trying to deposit some money to an online payment system I had never used before.
Why Spark?
If Spark is new to you, it is an top-level Apache project for large-scale data processing. Being able to process huge amounts of data and write less lines of Scala code is a big benefit. It makes sense to use a framework that can perform batch processing to build a machine learning model and then use its streaming functionality to apply the intelligence in real-time. Spark has also good integration with Hadoop, Amazon EC2 and can retrieve data from S3, HDFS, Cassandra, HBase and more..
Choosing features
Choosing features is a very important step in the process as this will have a large impact on its performance. Features may be different characteristics of user activities.
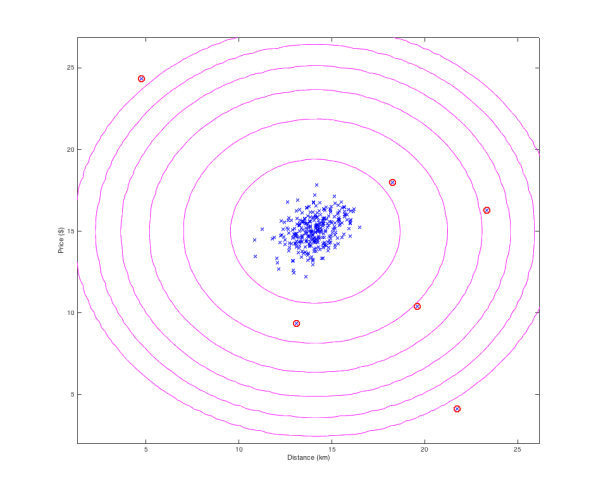
Imagine that you are a bank and want to identify fraudulent transactions. Location and transaction amount for example could be two of the features you want to use. If most of the transactions happen in London, an expensive purchase from Taiwan should be flagged as anomalous. In the real world, there are many more features used such as number of transactions, time since last transaction, merchant type, etc, but for the sake of simplicity we will only use location and monetary amount. Below is a plot of some training examples for the “Price” and “Distance from registered address” features. As you can see, the circled datapoints could be potential frauds.
Plotting the probability distribution of each feature before feeding them to an anomaly detection algorithm should result in a Gaussian distribution similar to the below.
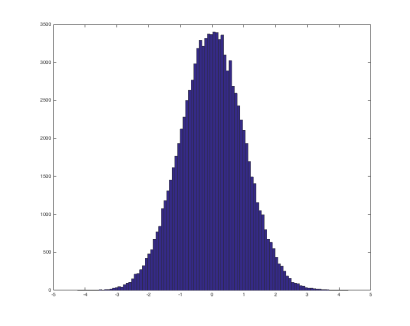
Gaussian distribution – generated with hist(randn(100000,1), 100)
If the data is not in a bell-shaped curve, applying various transformation to them (e.g. log, sqrt, pow etc) can bring them to the desired format.
Algorithm
Given a set of training examples, build a model p(x) that gives us the probability of an example being normal. If the probability p is below a threshold ε (epsilon) then the datapoint is considered to be anomalous.
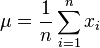
Specifically, given n training examples {x1, x2, …, xn}, each of which being a vector of features:
- For each feature, calculate its mean and its variance across all training examples
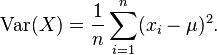
- Given a new example x, compute the probability of each feature using the Gaussian distribution function
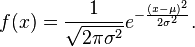
- Take the product p of all probabilities (in the fraud detection example, they should be 2, as we only have price and distance).
Anomaly if p < ε
Evaluation
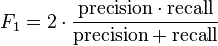
The evaluation of the algorithm will prove if the algorithm flags the correct examples. We will use precision / recall and F1 score in order to assess the performance.
Due to the skewness of the data (y=1 happens very rarely) classification accuracy is not a good evaluation metric. Imagine if we build an algorithm that 100% of the time predicts y=0. Using classification accuracy this would lead to 99% success but would always fail to find the very few anomalous examples.
We want to avoid flagging non-anomalous examples as anomalous (false positives) or missing out on real anomalies (false negatives). In the former case, decreasing the parameter ε can help, whereas in the latter increasing it can have a better effect. However, in many cases the algorithm sometimes fails to find anomalous examples regardless of the epsilon value. This means that our feature selection process should be improved. Looking at the anomalous examples which the algorithm failed to find and trying to find what differs from the normal ones gives inspiration for additional features that are required. Features that indicate something is wrong when taking very large numerical values or very small ones are good candidates.
Running on Spark
Running on Spark can give us the efficiency of writing quickly code that runs in a distributed system. Spark handles the parallelization and the orchestration of the data processing tasks pretty neatly.
The following diagram gives a high level idea of the model architecture. Once we build the model using historical data then we can then use it in real-time to predict if new incoming data points are anomalies or not.

Anomaly Detection Batch – Stream Model
Spark allows us to read straight from a file and convert it to a Resilient Distributed Dataset (RDD). To convert the RDD of Strings to the appropriate RDD Vector data structure we need to parse the raw CSV data and build Vector objects
def parseFeatures(rawdata: RDD[String]): RDD[Vector] = {
val rdd: RDD[Array[Double]] = rawdata.map(_.split(",").map(_.toDouble))
    val vectors: RDD[Vector] = rdd.map(arrDouble => Vectors.dense(arrDouble))
    vectors
}
An RDD[Vector] format will allow us to make use of the mllib Statistics package of Spark, that takes the RDD[Vector] as input and applies useful statistical operations such as mean, variance, max, min etc.
val stats: MultivariateStatisticalSummary = Statistics.colStats(data)
val mean: Vector = stats.mean
val variances: Vector = stats.variance
Having found the mean and variance of the training set, we need to compute the probability density function for each example in the cross validation set. The product of the probabilities of each example will be then compared to ε in order to identify if it’s an anomaly or not. Given a set of labeled points, we could find how well our algorithm performs. This is the purpose of the cross validation set. It is a dataset of labeled points used to optimize our process and find the optimal value of epsilon where the F1 score is highest.
Through this trial and error process, trying different values of ε can give us different F1 scores. We can then find the value where the F1 score is highest.
A good split of the dataset is to use
- 60% of it as training examples to build the model
- 20% as a cross validation set with anomalies into it
- 20% as our final test set that our algorithm has never seen before
/**
  * Uses the labeled input points to optimize the epsilon parameter by finding the best F1 Score
  * @param crossValData
  * @param anomalyDetectionModel
  * @return
  */
def optimize(crossValData: RDD[LabeledPoint], anomalyDetectionModel: AnomalyDetectionModel) = {
  val sc = crossValData.sparkContext
  val bcMean = sc.broadcast(anomalyDetectionModel.means)
  val bcVar = sc.broadcast(anomalyDetectionModel.variances)

  //compute probability density function for each example in the cross validation set
  val probsCV: RDD[Double] = crossValData.map(labeledpoint =>
    AnomalyDetection.probFunction(labeledpoint.features, bcMean.value, bcVar.value)
  )

  //select epsilon
  crossValData.persist()
  val epsilonWithF1Score: (Double, Double) = evaluate(crossValData, probsCV)
  crossValData.unpersist()

  logInfo("Best epsilon %s F1 score %s".format(epsilonWithF1Score._1, epsilonWithF1Score._2))
  new AnomalyDetectionModel(anomalyDetectionModel.means, anomalyDetectionModel.variances, epsilonWithF1Score._1)
}
Most of the price datapoints range between 65-100 dollars and distance (from registered address) datapoints range between 3-8 km. After running the code we find out that 57 anomalies (out of 500) were detected. For example:
[Price ($), Distance (km)]
[93.47, 6.07] -> normal
[85.39,11.06] -> too far from registered address
[124.46, 5.65] -> too pricey
Spark uses lazy evaluation to calculate the results. It tries to avoid all computation until it is really needed which makes it very efficient at times. For example, a map transformation will not be computed unless a reduce (or some other action) is needed later on.
Conclusion
We saw how we can build a distributed algorithm on Apache Spark to perform anomaly detection on financial transactions. Spark makes code writing painless and abstracts the complexity of distributed processing.
Stay tuned for the next post which is going to include Spark Streaming examples for realtime integration. You can subscribe to the blog using your e-mail.
Follow @mvogiatzis

[…] https://micvog.com/2016/05/21/using-spark-for-anomaly-fraud-detection […]
[…] Using Spark for Anomaly (Fraud) Detection […]
[…] The application we will deploy detects fraud in financial transactions as explained in this blog post. […]
[…] The application we will deploy detects fraud in financial transactions as explained in this blog post. […]
Thanks Michael, appreciate the post!
You’re welcome Ben! Glad you found it useful.
Hello: I am trying to apply this to Insurance Fraud Detection. Would you have any Architecture Diagrams showing the system interactions and deployment model ?
Hi, no, no other diagrams, unfortunately. Insurance fraud detection seems an interesting use case. What are you trying to detect?
Hi !
Thanks for the blogpost and the code ! I was wondering if you had any pointers towards applying this to text data where the values in the vectors would be TF-IDF scores (how to handle zero values/possible means and variances at zero sometimes), to identify unusual documents in a dataset.
Thanks a lot !
J
Hi Jessica, I haven’t tried it but I don’t see why not.
Another relevant algorithm you may want to check is the first story detection project. Converting text messages to vectors and applying TF-IDF and locality sensitive hashing gives you a score of each document and you can define how relevant the document is compared to the ones in the past. Here’s the URL: https://micvog.com/2013/09/08/storm-first-story-detection/
Cheers,
Michael
i am trying to implement using spark + cloudera but i need the dataset how can i download it
Hey Walid, the dataset is randomly generated. You can create it in Matlab like this: hist(randn(100000,1), 100).
hi Micheal i tried to run this code on cloudera but i have this error
Exception in thread “main” org.apache.hadoop.mapred.InvalidInputException: Input path does not exist: hdfs://quickstart.cloudera:8020/user/root/src/test/resources/training.csv
do you have any idea
thank you
Good job, very interesting content